What’s the Big Data Idea is Bringing Big Data to the People.
I’m passionate about Big Data.
I believe Big Data will change everyone’s lives whether you like it or not. It’s not just about how your cell phone let’s you know about traffic or that Target knows your daughter is pregnant before you do. The immensity of the impact cannot be overstated.
I’m passionate about solving Big Problems with Big Data.
9/11 taught us many things about the world and how small it is. That was a pre-Big Data world, too. Unlike Apple computers and bleeding edge technology that only applied to the affluent, Big Data touches everyone – even illiterate natives in remote regions. Big Data can solve – perhaps for now assuage – Big Problems such as hunger, disease, piracy, terrorism, human trafficking, wildlife preservation.
I’m not a smart man…
But I know what Big Data is. I know enough to combine it with my creativity and experience to make great visions of Big Data taking on Big Problems.
I’m not a baseball fan,
But I saw this clip recently and it reminded me about perseverance.
It’s not just about baseball. There’s something each of us are passionate about doing.
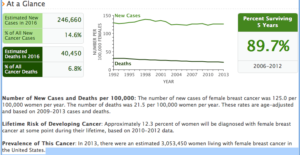
My mother died of breast cancer in 1989. She was 44. Ironically, she was considered a “survivor” because she lived for five years after diagnosis. She was a teacher and during those five years, she never missed a day of school. She saved the summers in between for chemo, two rounds of radiation and a mastectomy, all at famed MD Anderson Cancer Center in Houston, which was considered then and remains today one of the world’s premier cancer treatment facilities.
So what has happened in the almost 30 years since?
It’s not very impressive, is it?
Yes, there is a decline in the mortality rate – for less than 5 years. As grateful as I was for those five years, I would have liked to have 20 years or more. I’d like to know that today much fewer women get breast cancer. I want it to look like this chart of polio occurences.
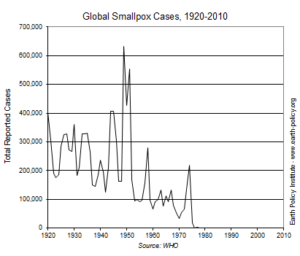
Polio hits the dirt
That makes me pretty demanding too. Cancer is tough stuff. Many brilliant minds and passionate hearts have dedicated their lives to research of the disease and care of its victims. Is it too much for anyone to figure out how to cut the numbers?
In my years of work in resourcing individuals for worldwide mobilization, the numbers represent people, I realize that each node has excruciating significance. Who is that specific person that melts into those numbers? Was it your mother or aunt or sister? Did they live less or more than the survival 5?
Average Joe
We live by statistics. We toss around the words “average” and “normal” more commonly and casually than their less technical counterparts “mostly” or “seldomly.” We actually abuse statistics, using it to create desired response. Politics report crime is down or up X% to catch your vote; business marketing emphasizes attributes and effects skewed to get you to buy; teeth are Y% brighter or items contain Z% less calories. The media wants to grab your attention and activists want to prove their point. It’s the notorious tail wagging the dog. Data collection, data sets and data analysis are manipulated with ignorance or intent to provide facts and figures that support a cause.
Even without using statistics, our brains are wired to measure risk in ways that are often unrealistic. We assess situations trying to find cause and effect relationships when actually only coincidence is present. We perceive great risk where there is little (shark attack), and we underestimate potential dangers (driving to the grocery store).
Treat to the mean
What does cancer look like to the “average” victim today? A diagnosis via testing, a specialist doctor, and a suite of supporting consultant experts and services. A team is built to craft a treatment. This is goodness but it’s not the best we can do.
In this Ted Talk, Kristin Swanson explains her personal journey with cancer and the cold hard numbers.
To Kristin Swanson, this is personal. And to me, she is right. Treating every person as the mean is today’s standard, regardless of how many experts are in the room. Although that is amazingly better than even one generation ago, the medical research, as scientific as it is, is also subject to misdirection. Medical poor methodology and outright plagiarism is likely, as in many disciplines and forums.[i]
Two heads are better than one, and a whole team behind you definitely improves your odds. Going back to the stadistics, though how much has that made a difference?
Going from Little Data to Big Data
Medical school is not walk in the park; it is notoriously long and rigorous. I imagine the volume, velocity and variety of information learned in medical school has grown exponentially from even just two generations ago. Although the human body itself hasn’t changed (appreciably) in a couple thousand years, the amount of research compiled about body parts, human habits and social environments again expanded in quantity and quality in the past two generations. But that is small data.
We can do better
Kristen gives the example of Patient X whose tumor is larger after therapy. In a small data world, this is a “failure.” Therapy => larger tumor => failure. In reality, had Patient X been the famed “mean” participant, his life expectancy would have been 15 months. This Patient X lived another five years. So where is the true failure?
This doesn’t mean doctors are wrong or idiotic about their techniques and therapy recommendations. These physicians are compassionate and intelligent resources for developing appropriate therapy according to standard practices. Unfortunately, they are making life decisions for patients with relatively very little information that is very biased.
Comprehending the intricacies of the infinite array of influences that affect a single person’s holistic health profile is impossible psychologically. Humans (at this stage of evolution) can only hold so many numbers in their brain and then the matrix of combinations thereof quickly pushes override. Even if doctors could study harder or lean harder on tried-and-true practices in an attempt to maximize survival, it is still small data.
A Streetlamp Named Desire
There’s a joke told several ways about a man at night searching for his car keys under a streetlamp. A passer-by/neighbor/police officer stops to help him look and begins by asking where he thinks he has dropped the keys. The man responds he lost them down the street near where his car is parked. “Why are you looking here then?”
“Because this is where the light is.”
Tackling Big Problems – such as cancer – has been looking for those car keys. What we know about cancer is under the streetlight. The complexity of cancer and other Big Problems has been beyond the tools and capabilities we have been utilizing.
In comparison, polio and small pox were not complex; they were complicated. In these situations, enough experiments and enough coincidence unraveled the mystery and a vaccine was borne. This scenario is likened to untying the ear buds that were wadded up at the bottom of a backpack. Patience and grit win the day. Neither polio or small pox are even curable, but they are preventable. That prevention significantly dropped mortality rates. Small pox was even considered eradicated from the earth in 1980.
Big Problems need Big Data. Big Data’s capability has only come into play within the past ten years. Its nascent tools are just evolving. The information of the world previously has been only ether, captured in memory through unreliable replication or in select recording capability of finite data points. Now it is being captured in ways and means –subtle and overt – that even the most creative imaginations didn’t predict.
Big Data is possible now for a couple of reasons. Data acccomodation was limited in a small data world but now digital capture has created an expanding flow that is not only easily made, but also sharable and searchable. Punch cards and floppy disks were the beginning of the end of small data. Storage is just the first tenet.
The power to manipulate the data is keeping pace with capacity. The cell phone of 10 years ago (think flip phone) had more power than what was possible for the Apollo missions to the moon. Today’s typical work environment still relies heavily on spreadsheets and traditional databases, an abacus of sorts relatively. This gap between what is possible with data that is collected and what is done with it sets up the huge demand signal for data scientists. We need intelligent people who can manipulate Big Data.
Finally, Big Data needs to be articulated – art meeting science. Data scientists are needed for accuracy and intent but the expression needs a handshake with the operators of the information. In the case of cancer, this is doctors and specialists and caregivers. Data visualization rounds it out because the reasonings and relationships are far more coquette and piquant than dashboards and powerpoints.
Heavy Lifting
Big Data is complex – not complicated. It’s chaotic. The earbuds cannot be unraveled; they continuously contort with each pull of a knot. Each of us carries around genetic predispositions which are either enhanced or deferred with the daily choices that compound into life time patterns and twist with chance events. How much you weigh or what you eat or drink or where you live or how you work or play or where you travel or stay put or how you relate to friends, family and coworkers – these all interplay until a tipping point is reached.
Big Data captures the minutiae of internal gyrations and external influences affecting that probability of cancer. Big Data is where the breakthrough lies.
Since Big Data has become a capability, we can go beyond treating the mean. A cancer treatment need no longer be determined by your doctor, or a suite of doctors. It can be determined by all the doctors who have ever treated cancer. A patient’s medical history isn’t a couple of pages of discrete data points. It is a continuous flow of information illuminating personal habits, events, and discretions. All the dedication to cancer research folds into Big Data.
Big Data is not a Holy Grail of itself. Big Data helps us see information in a way never before capable, evolving a holistic methodology. With that power comes great responsibility. Like statistics, Big Data outputs can become ugly monsters or heavenly returns.
A tree falls in the forest. A roof falls in. A business fails. A stock market crashes. A disease spreads.
Sh!t happens
Who or what caused it? Cause and effect – causality – is deeply woven into our lives.
Figuring out who or what caused something is a universal application of everyday life as well as one of global consequence. We want to know why something happened, regardless of good or bad outcomes.
Researchers use causality to test whether a drug has the desired effects as well as to control the less desirable side effects. It’s used by scientists to figure out the common cold or/and the secrets of the cosmos. What-caused-it figures out who is going to pay for damages – for the automobile accident or for global warming. It’s used by governments to develop regulations and uphold laws.
Knowing what caused what not only tries to explain what already happened, it also leans forward into the future. Causality is used for the ultimate gold – prediction. You use it to keep your finances and your safety. Business tries to predict who is going to buy what. Weather forecasters use causality to keep us dry as well as out of danger.
If we know what causes what, we can avoid the unfortunate and encourage the beneficial. So why doesn’t causality work?
Causality is a very flawed practice
Cause and effect is largely opinion. Consider the controversy over global warming. Do too many cars burning gas melt the polar ice caps? Are there too many people breathing too much? Is it a wobble in the earth’s rotation? Is it just … the way it goes? Is the globe even warming?
The debate consumes some of the greatest minds of science. Then politics and politicians become involved. Other non-experts but prominent participants such as actors and public figures weigh in. Finally, the “average” consumer and citizen have say in the truth or perception as well. Should each person’s opinion have equal weight? (when they don’t)
Causality is assailed by lots of variables and lots of interpretations, which not only seek to figure out what has happened but also how to affect the future.
So can we change global warming? Do we want to change it? What happens when we do change it? Will we get the desired results?
Getting Personal
We all want to know cause and effect, so let’s look at some personal examples – weight control. Does eating a doughnut make you fat? Does it take eating a doughnut every day to make you fat? What if you’re one of those really skinny people? What if you ran a mile or a marathon after that doughnut?
What about cancer? Smoking = cancer, right? It’s not just one cigarette though. Is it one year of smoking? Day 366 or many years? Just how many does it take and what other factors increase or decrease that opportunity? That’s another causality factor. How can you explain those that smoke for decades without getting cancer?
Real or Perceived?
People like the security that numbers and calculations provide. Causality is no exception. There is a preconception of fairness that 2 + 2 = 4 and no one gets hurt. Simple addition though doesn’t exist in a bubble (unless you’re a mathematician). We use numbers for decisions. Small decisions are whether to purchase those cool shoes by whether the bank account supports it. Traffic engineers quantify what is safe with speed limits, which makes enforcing those rules “easier”.
Big decisions are global warming or poverty or war or whether a corporation or a government is operating in the black or the red. Unfortunately like any good story, numbers can be manipulated, either by ignorance or intent – ask those who invested in Enron and Goldman Sachs.
Mistaken Identity
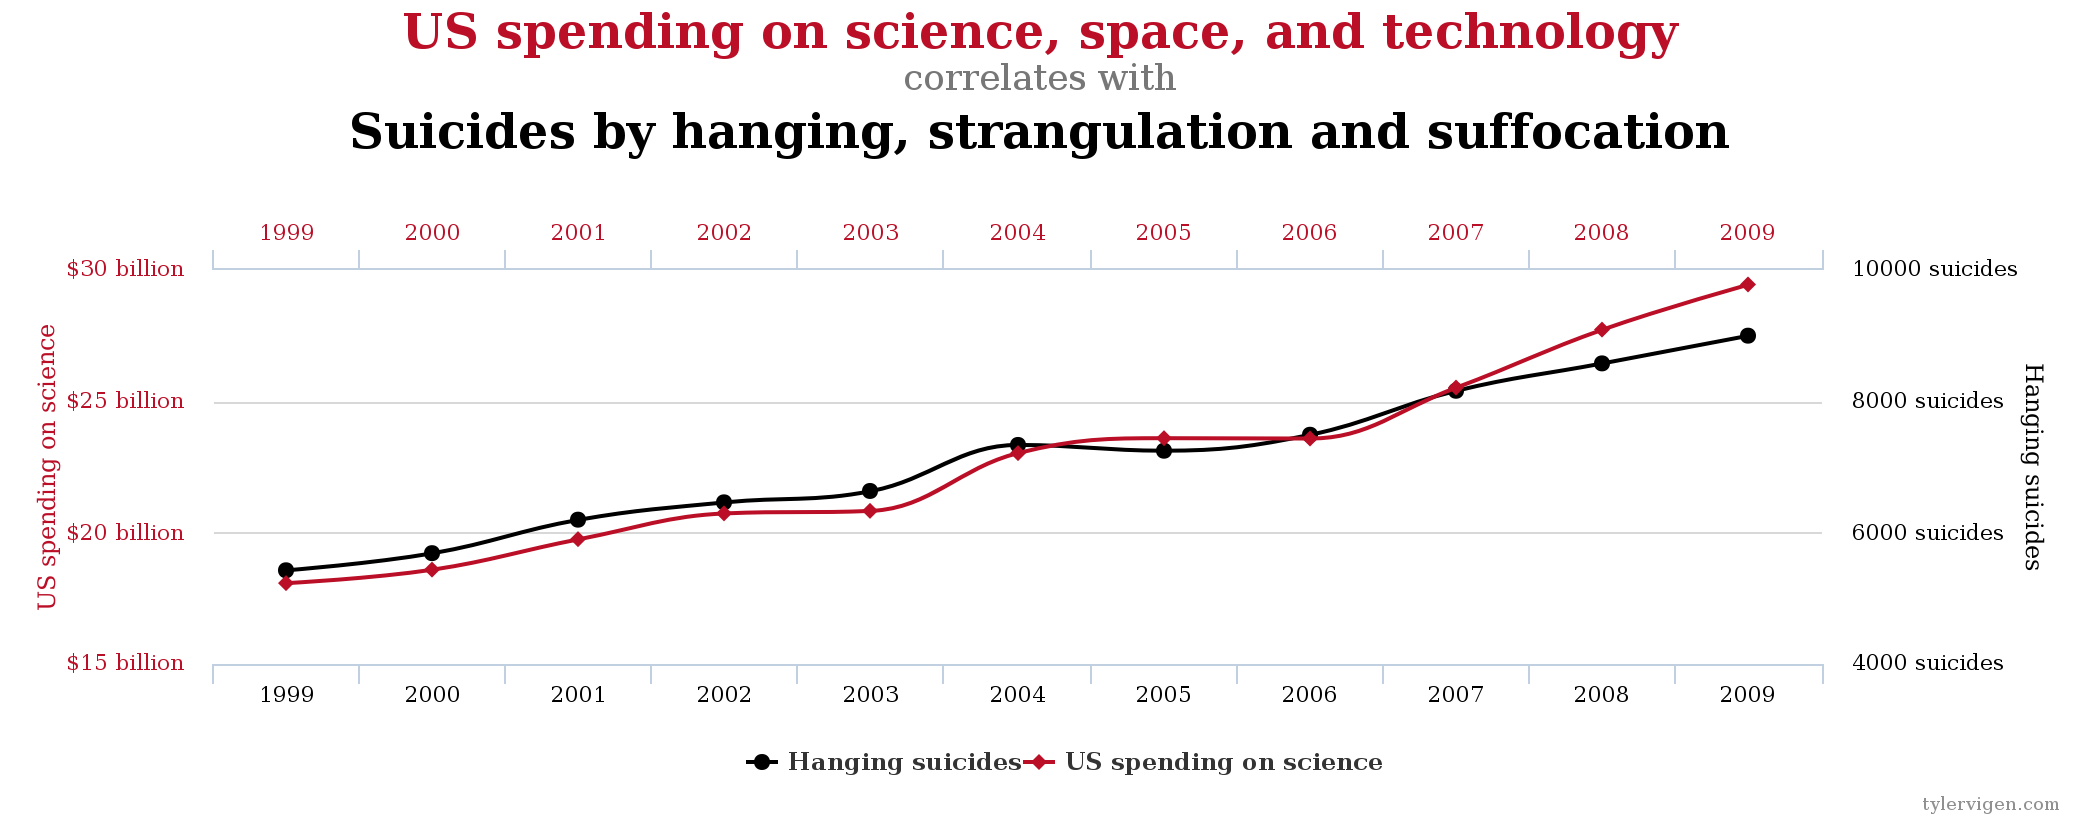
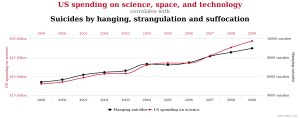
So causality often uses numbers for quantifying things that are a bit fuzzy. But when is it causality or its misunderstood cousin – correlation? This graph represents a strong correlation between US spending on science and technology and an increase in suicide by strangulation. A strong correlation does not mean that financing more STEM leads to more suicides. That’s the difference between correlation and causality, a fine line we are able to appreciate given an obvious scenario.
What if it’s not so obvious?
Gorilla in the Room
In The InvisibleGorilla Christopher Chabris and Daniel Simons explore intuition via a psychology experiment demonstrating how we overlook the obvious while concentrating on a task at hand. Survey participants are asked to count the passes while watching a video of players passing a basketball. During all this passing, a gorilla comes in the middle of the circle beating his chest and then departs.
Recreated in numerous scenarios in numerous countries, half the subjects never notice the gorilla.
The lesson? The authors use this experiment to underlie six areas in which our data collecting minds short circuit: attention, confidence, knowledge, memory, potential and yes, cause. Their chapter on causation centers on how people depend upon pattern recognition to solve problems or prevent them from occurring.
A physician cobbles symptoms together with personal experience and training to fix what ails you. A stock market trader does the same to make money. A parent tries to guide their child to safety and prosperity using their successes and failures. As crowds or governments or societies, we perpetually absorb environmental factors and interpolate results based on causality.
“Our world is systematically biased to perceive meaning rather than randomness and to infer cause rather than coincidence. And we are usually completely unaware of these biases.” P.154
Our minds have fascinatingly adapted to interpolate vastly more complicated situations. It’s also disturbing that biases build up like plaque in which we are unaware of the distortion.
Even if you think you’re an EXPERT on correlation versus causality, watch this Ted Talk and personal awareness quiz. Test your perspective of the world and learn some pretty cool data points.
Big Data Bias
How about Big Data? Big Data is not immune to the misdirections of faulty intuition. Like a bigger hammer, the momentum of Big Data could be perceived – or utilized – inaccurately with that much more destruction.
The glory though is that Big Data can overcome those causality challenges because of the Big-ness of the Data. The volume, velocity and variety usurp sampling “thinking”, hypothesis testing and small data limitations.
Small Thinking
This Khan Academy lesson in causality and correlation demonstrates the trip ups of small data sets and hypothesis testing. Using very little data from a small but statistically significant sample, an article suggests that one thing – eating breakfast – can decrease childhood obesity. The author never relays eating breakfast prevents obesity. As the lesson expounds, the careful word selection includes enough suggestion while omitting some relationships.
In this example and in every hypothesis test, a plethora of variables must be held constant in order to create any deductions from the experiment. Like the examples above regarding eating donuts or preventing cancer, a hypothesis test tries to still a moment in time to get an answer when the reality of life is much more complex. Life an open system, subject to a world of whims and multiplying factors. Life is chaotic, vast dynamic systems sensitive to initial conditions that divine behavior.
The fault with small data can be overcome with Big Data capability. Big Data captures more, holds more and manipulates more data on a level we are really just beginning to comprehend. That transformation begins with removing the plaque of small data thinking.
Big Data is best deployed en masse, collecting and digesting mass quantities of volume and variety of sources. Without hypothesis testing, the information is observed for the patterns and outliers that arise. Unlike the doctors and stock brokers and parents, Big Data weaves without bias.
So It’s Only Natural
Causality is natural. We do it without thinking, which is both a survival mechanism and a fault. We draw conclusions from information and we suffer sometimes from those derivations from incorrect assumptions. Although errant thinking can be overcome by careful thinking and rigorous process, some preconceptions will always elude us.
Big Data is subject to the same bias errors, and it can be even worse because of the volume, velocity and variety of data. But Big Data is a new methodology capability. That capability is still being explored and it needs to be done outside of small data context.
The signal in the noise though is brilliant. It can comprehend solutions we would never dreams and it will solve problems we didn’t think possible. Think Big. It’s coming.
Why should the ancient practice of scientific method be questioned?
AUTHORITY.
As individuals in society, we hold others in regard for accomplishments that give them authority, such as doctor for their medical degree. Although with the internet at our fingertips we have gained access to ever-greater amounts of information, we have also learned some skepticism, but still retain some sheep mentality.
Goldacre points out we still have a retained awe for authority. With a simple example, he explains how authority can be accepted by a large, popular audience when the authority is actually less than ideal.
With the ubiquity of the internet, authority will only continue to be an issue for any organization or society at large. Big Data is more of an open source platform which involves creating data lakes. These currently infuse the data silos of an organization, or in the case of drug efficacy, corporate secrets.
“SCIENTIFIC” STUDIES
Goldacre expounds upon how cause and effect studies are “published” with basic flaws in even the simplest cases. The testing environment does not accurately, or sometimes even remotely, simulate the results touted. In addition, the plethora of factors involved is rarely accounted. The test sample sets are representative of general or specific populations, but are these representative of YOU?
Because Big Data is able to consume a vast variety of data, not adhering to strict control methods of traditional scientific method frees the data to more readably present a viable pattern. Trying to hold all other variables constant in a scientific experiment is challenging at best and completely unrealistic practically at worst. (In real life, you can’t hold all the scientific experiments environmental factors constant to obtain the same favorable results.)
OUTCOMES
Goldacre somberly explains then that these simple examples are just that – simple. Drug studies that are the basis of doctors’ “knowledge” of treating YOU and society are based upon far more complex … and jaded processes.
Our beliefs and expectations of a drug’s efficacy shape the outcome. He gives several examples of how data is effectively rigged to produce a carefully prepared outcome. Thus making the result look … like what they want you to see.
One of the premises of Big Data is finding patterns in the data, not looking to prove or disprove a theory. Therefore, trying to rig an outcome one direction or the other is not a Big Data practice.
(…so would a drug company ever what to use it?)
MISSING DATA
Goldacre’s final, sobering point was actually the jumping off point for his next Ted Talk on how drug trials have dangerously biased results.
Missing data is one of the greater challenges to Big Data execution. Several methods are in practice to compensate for gaps such as null values or incongruous data sets. The difference with Big Data is that it readily addresses missing data as opposed to discounting it as Ben Goldacre explains in his examples. Because Big Data involves huge volumes of data points, the missing data compensation practices more readily present an accurate representation of the information.